
In December 2010, we wrote an article called PIIGS Get Slaughtered about the debt crises unfolding in Portugal, Italy, Ireland, Greece and Spain (a.k.a. “The PIIGS”). At the time, these countries were being forced to confront the consequences of years of borrowing and spending as investors increasingly questioned their ability to repay their debts.
We wrote:
“Earlier this year, Greece was slapped with economic reality when the populace was informed that retirement at age 60 may not be a realistic expectation. The rioting that ensued illustrated just how distant they were from economic reality before being slapped with it.”
As lenders lost confidence in Greece, the interest rate on its two-year government bonds soared from just over 2% to more than 18% in a matter of months.
Meanwhile, the United States could borrow for almost nothing. But we wondered whether our own growing debt, entitlement spending, and inability to rein in deficits might someday create a problem of our own.
That was almost sixteen years ago.
The U.S. national debt was around $14 trillion.
It just crossed $40 trillion.
But while the number is large, how do you know when it’s actually a problem?
You have to put it in context. A growing economy can support a growing amount of debt, so the dollar amount alone doesn’t tell us much. A better measure is debt relative to the size of the economy . . . or debt to GDP.
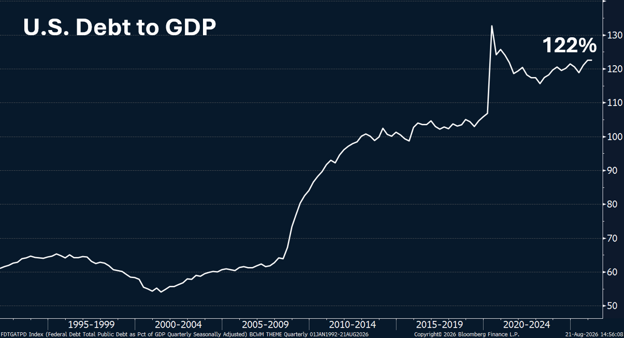
When you look at it on a relative basis, the debt is less alarming than the “$40 trillion” headline. Nonetheless, the trajectory is concerning.
And the reason the debt keeps growing is pretty simple: increasingly, we have been spending more than we take in.
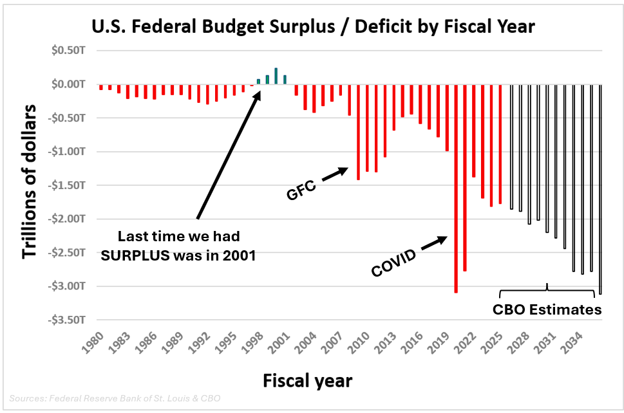
The bars in the graph above represent our federal budget surplus or deficit by year. We haven’t run a surplus since 2001.
Some of the biggest deficits are easy to explain. The Great Financial Crisis (GFC) and COVID required extraordinary government spending. But those crises are behind us, and we’re still adding roughly $2 trillion to the debt each year . . . and the Congressional Budget Office (CBO) projects even larger deficits ahead.
One way to raise revenue is through tax hikes, and that is politically fraught (and arguably slows down the economy, so doesn’t really solve the problem).
Even more politically fraught is dealing with the spending side of the equation. The chart below shows U.S. government spending divided into major categories. This is the real problem. Social Security and Medicare spending (mandatory spending) continue to grow, while interest on all that accumulated debt also becomes a larger piece of the budget. Meanwhile, discretionary spending (the part Congress argues about every year) is actually projected to decline relative to GDP.
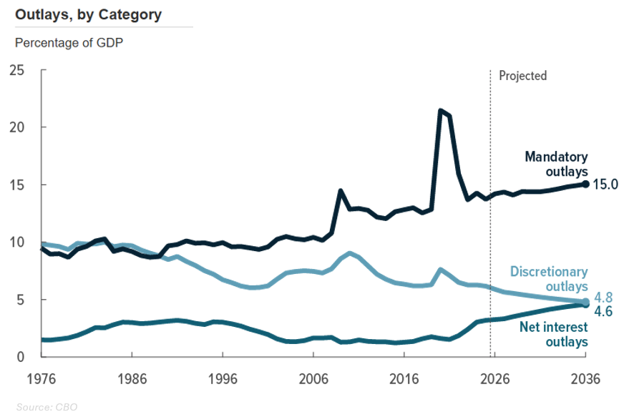
The biggest pieces of the budget are the hardest to cut.
Social Security and Medicare benefits are largely determined by existing law, and tens of millions of Americans have planned their retirements around receiving them.
As noted in the opening paragraphs, sixteen years ago, when Greece told its citizens that retirement at age 60 might no longer be feasible, people literally took to the streets.
We don’t expect Americans to start rioting over the Social Security retirement age. But the point we made then still applies today: it is easier for governments to promise benefits than to eliminate them.
That makes it difficult to simply “cut our way” out of the problem. And the longer deficits persist, the more debt accumulates, and the more we spend servicing that debt.
None of this means the United States is on the verge of a Greece-style debt crisis.
There is an important difference between having a concerning fiscal trajectory and having a debt crisis. Greece crossed that line when lenders began losing confidence in its ability to repay its debts. Interest rates soared, making an already bad fiscal situation dramatically worse.
The United States isn’t there. Investors around the world still willingly lend money to the U.S. government, and Treasury bonds are still considered one of the safest investments in the world. And while our national debt has gone up nearly threefold in the last sixteen years, the U.S. stock market (S&P 500) has returned over 700% percent!
But there’s also the 2010 lesson worth remembering: you don’t want to wait until lenders lose confidence to start worrying about the math.
So, what does all of this mean for us as investors?
It doesn’t mean we’re abandoning U.S. Treasuries, betting against America, or making wholesale changes to portfolios because the national debt crossed an arbitrary round number. People have been predicting an imminent U.S. debt crisis for decades, and positioning a portfolio around that prediction has been a losing strategy.
Instead, we focus on the ways a growing debt burden could actually affect markets: interest rates, inflation, taxes, and economic growth. And we weigh those risks against the opportunities markets are giving us today.
For example, longer maturity bonds pay you a higher interest rate but drop in value if debt (and other) concerns persist and interest rates move higher. And bonds can go up in value if rates move lower. It is a delicate balance. For now, we’re content with slightly shortening our maturities to lock in the higher yields with less price risk.
More broadly, we diversify because this problem can ultimately resolve itself in various ways. Washington could cut spending, raise taxes, tolerate somewhat higher inflation, grow its way out of part of the problem, or, most likely, muddle through with some combination of all of the above.
Sixteen years ago, we wondered whether the United States would eventually have to confront some of the same fiscal realities Europe was confronting then.
Our debt has nearly tripled since.
We still don’t know when Washington will seriously address it. Fortunately, we don’t have to predict that date to invest responsibly around it.
The $40 trillion number makes for a good headline. Just like $50 trillion will make for a good headline in 2031.
This information is provided for general information purposes only and should not be construed as investment, tax, or legal advice. Past performance of any market results is no assurance of future performance. The information contained herein has been obtained from sources deemed reliable but is not guaranteed.