Note: This article was originally published on June 7, 2023. While the discrepancies between different stock “markets” may change over time, the core lesson remains relevant: understanding what’s behind the headlines on CNBC is crucial to get a true understanding of the investment landscape.
“How’s the market doing today?”
This must be the most frequently asked question in the investing world. And even though there are many “markets,” the question is almost always in reference to the U.S. stock market and its most popular benchmark: the Standard and Poor’s 500 Index (aka the S&P 500 or the S&P).
The S&P 500 Index tracks stock prices of the 500 largest U.S. companies. But each stock does not have an equal impact on the performance of the index because they are weighted by their market capitalization, an elaborate term to describe total company value or size. For example, the largest company on the list, Apple, Inc., makes up about 7.5% of the index. The remaining 92.5% of the index is spread among the other 499 stocks.
There is good reason for using a market-cap weighting system. After all, more people own Apple stock and thus care more about how it is performing than, say, Dish Network, the smallest company on the list. So, Apple should carry more weight. But with this method, the index is concentrated in a small number of stocks . . . which sometimes can be misleading.
In normal times, about 20% of the index weight is in just ten stocks. But today, the S&P 500 is the most concentrated it’s been in decades. As of May 31, 2023, the top ten stocks accounted for over 32% of the total! What is even more remarkable is that seven of those ten stocks are tech companies. So, “How’s the market doing today?” is actually more like, “How’s big tech doing today?”
In fact, a recent article published by JP Morgan in 2023 pointed out how the 8.3% year-to-date performance of the S&P 500 (as of April 27) was overwhelmingly driven by a handful of tech stocks.
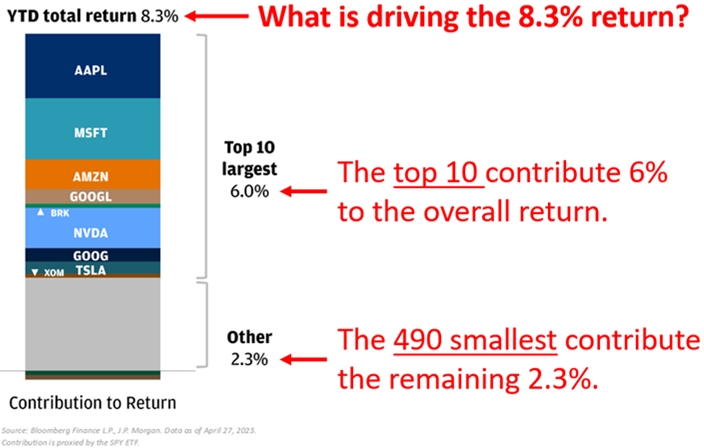
Put another way, the top ten stocks had an average return of over 22%. Everything else . . . about 3%. Almost every stock went up by 3% on average, but “the market” went up 8.3%?
Trust us. The numbers are correct. The confusion is a by-product of market-cap weighting. But what if there were another method?
Enter . . . the equal-weighting method. This method couldn’t be simpler. The return of an equal-weighted index is simply an average of each company’s return. Therefore, the top ten stocks in the Equal-Weighted S&P 500 Index only make up 2% of the total index. Much less than the current 32% weight they hold in the “regular” S&P 500.
And when the equal-weighting method is applied to the S&P 500 in the JP Morgan example above, the resulting year-to-date performance is 3.2%. A significant drop from the 8.3% return of the market-cap weighted S&P 500.
Over long periods, these return discrepancies diminish, so the method chosen doesn’t matter all that much. Since 1990, the S&P 500 has gone up at an average rate of 9.9% per year, and its equal-weighted version has gone up 9.5% per year.
However, in any given year the difference can be dramatic. In fact, for the twelve months ending May 31, 2023, the S&P 500 is up 2.9%, but the equal-weighted index is DOWN 4.4%. That’s right . . . if you didn’t own those top ten companies, you actually lost money this past year. The widely quoted market-cap weighted S&P 500 Index is outperforming its equal-weighted counterpart by one of the widest margins since the 2000 dot-com bubble.
Our goal at BCWM is to build a diversified portfolio that yields a good return, while, more importantly, mitigating risk. As a result, the equity portion of client portfolios is more reflective of an equal-weighted index. This index offers a more balanced representation of the overall market that is similar to how a diversified portfolio would perform.
That is not to say we should ditch the S&P 500. It has many strengths and is a good measure of how the total value of the stock market is changing. Customarily, it is “the market.” But the S&P 500 kind of disregards the whole concept of not putting all your eggs in one basket. So, it is important to take a broader view when measuring the performance of the “stock market.”
This information is provided for general information purposes only and should not be construed as investment, tax, or legal advice. Past performance of any market results is no assurance of future performance. The information contained herein has been obtained from sources deemed reliable but is not guaranteed.