The most recent inflation report stated that prices had increased 9.1% in the past year, “the largest increase in forty-one years.”
The largest increase in forty-one years? Wow! We know this sounds crazy, but one of our co-founders actually began his career exactly forty-one years ago.
And he notes some startling differences between 9.1% inflation today and 9.1% inflation forty-one years ago.
In 1981, interest rates (which are typically affected by inflation) were drastically higher than they are today.
In 1981, money market funds paid annual interest of 18%. That wasn’t a typo: 18% money market funds that were liquid and had no penalty for early withdrawal. Today, you are lucky to get one percent.
And 30-year U.S. Treasury Bonds in 1981? They yielded over 15%. Today, the interest rate on a 30-year Treasury Bond is just over 3%.
Why the gigantic disparity? Well . . . back then, very high inflation had persisted for years. The common belief was that it would continue. And because people thought high inflation would persist, markets priced in high interest rates for the next thirty years.
Today, the causes of inflation are less permanent (transitory?) and the market knows this, so it’s pricing in lower interest rates for the future.
Ask around and you’ll get lots of opinions as to why inflation is high. Whatever the reason(s) for inflation, it was clearly made worse by a pandemic, supply-chain disruptions, and a nasty war in Ukraine.
The severe economic disorder caused by the pandemic is (basically) over. The supply-chain issues are slowly improving. And the war, while still significant, is not quite the headline-grabber it was four months ago.
And while you weren’t looking, the prices of a long list of commodities have declined significantly from their peaks earlier this year. Here’s a short list:
Aluminum -41%
Lumber -61%
Copper -32%
Wheat -46%
And there are many more. Also, gasoline at the pump, while still expensive, has declined from recent high prices. Down 9% in the last month.
In addition, the ridiculously red-hot housing market is cooling off. Fewer homes are being sold, the “inventory” of homes for sale is increasing, and the number of home showings is down. However, the way housing prices are measured results in a lag. So, while we strongly suspect home price growth is stalling, it may take another month or two to see this in the data. Housing is a bellwether for consumer health, and we are watching this development closely.
We expect that CPI numbers will begin declining over the next several years. The bond market agrees. Right now, the treasury market implies that next year’s inflation is going to be 3.6%, much lower than the 9.1% we just experienced. That’s called “disinflation.” Still, the relatively high inflation we have experienced has not only made life more difficult for consumers, it has also led to wonky markets.
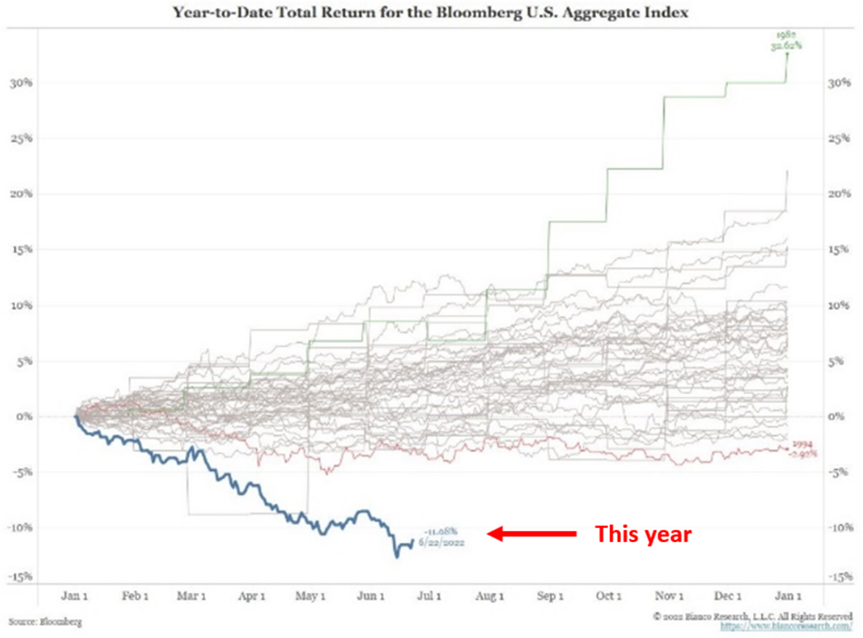
This year we have witnessed the sharpest selloff in the bond market in a generation. One historian calculates it as the worst since 1842. It’s been so long since bonds have acted this way, it requires a historian to provide context!
Data is readily available going back to 1976, and the chart below shows just how dramatic the 2022 bond selloff has been. The lines on this graph represent full-calendar-year returns for the bond market. The best year for bonds was 1982, up 32.62%. The worst was 1994, down 2.92%. So far this year, the bond market is down double-digits.
Most readers are probably aware that the stock market is down significantly this year (currently, 16%). And perhaps some know that the bond market very rarely has a negative return for the year. However, for the last 50+ years, there has never been a calendar year with negative stock and bond performance.
Typically, when stock prices go down, bond prices go up (and vice versa). This isn’t always true, but it is part of the rationale behind owning a diversified portfolio. You know, not putting all your eggs in one basket. In 2022, diversification has not been doing its job very well.
While the drop in bond prices depressed the value of our portfolios, it has also created an opportunity. Today, bonds look more attractive relative to stocks. Yes, stock prices are lower than they were last year, but if the economy is heading into a recession, they will likely get cheaper. In a tough economy, we like the reliability of cash flow that bonds (and high-dividend-paying stocks) provide.
We think it is likely that a recession is around the corner. At least, we are preparing for it. One of the “canaries in a coal mine” we’ve previously mentioned, an inverted yield curve, has died. Through two major announcements this week, we’ll hear a lot about the economy and get answers to some major questions. Did the economy grow in the second quarter? And what is the Fed’s next step in their battle to tame inflation?
To the first question, our answer is “barely, if at all.” To the second, the Fed has tried their hardest to telegraph their next move, so we think it’s all but certain they announce another big rate hike.
This information is provided for general information purposes only and should not be construed as investment, tax, or legal advice. Past performance of any market results is no assurance of future performance. The information contained herein has been obtained from sources deemed reliable but is not guaranteed.
This information is provided for general information purposes only and should not be construed as investment, tax, or legal advice. Past performance of any market results is no assurance of future performance. The information contained herein has been obtained from sources deemed reliable but is not guaranteed.