There’s an old joke we like to repeat from time to time. It goes like this: “How do you make a 33 year-old guy act like a 43 year-old guy?” The answer? “Wait ten years.”
It’s not the kind of joke that elicits huge belly laughs, but delivered at the proper moment and in the correct context, it usually gets a chuckle or two. It’s a joke that illustrates that no matter how smart you may be, most of what you learn and know comes through experience. You can try to jam a lot of knowledge into a shorter period of time, but most of what you learn, you learn the hard way.
Mark Zuckerberg, the CEO of Facebook, is one of those brilliant 33-year-old Harvard grads who is now learning things the hard way. He allegedly trusted people who allegedly took “private and confidential” information from Facebook users, information that everyone foolishly thought was going to be kept private and confidential.
He also may have made the mistake of believing that, just because he was smart enough to create a multi-billion dollar company, he was also smart enough to run that same multi-billion dollar company. Creation and management are two completely different skill sets. By the time he is 43, he may have figured that out.
If you were one of those who were stunned by the revelation that your private and confidential information was compromised, you are most likely closer to 33 in age. Because by the time you are 43 (and certainly 53 and 63), the cynicism that life beats into you would have you be more surprised to discover your private information had NOT been compromised.
________________________________________________________
If the stock market hasn’t got your attention lately, well, perhaps you intentionally chose to ignore it. That’s not necessarily a bad thing, particularly if you have hired us to manage your investments for you.
But if you are not ignoring it, you may have noticed that it’s swinging up and down far more than it used to. Last Wednesday, the Dow Jones Industrial Average was DOWN more than 500 points in the morning but, by the end of the day, it finished UP 230 points. If you hadn’t paid attention, you might have thought, “Not bad, up 230 points for the day.”
On that day, the difference between the lowest point and the highest point was over 3%. To put that into perspective, we have only seen eight days where the Dow moved more than 3% in the past seven years . . . until this year. Since February of this year we have already seen SEVEN such days!
We are here to tell you whether they are up or down, wild, exaggerated market swings are bad and ultimately lead in the wrong direction. Which, by the way, is exactly what happened last week. The next two days, the Dow was down over 2%.
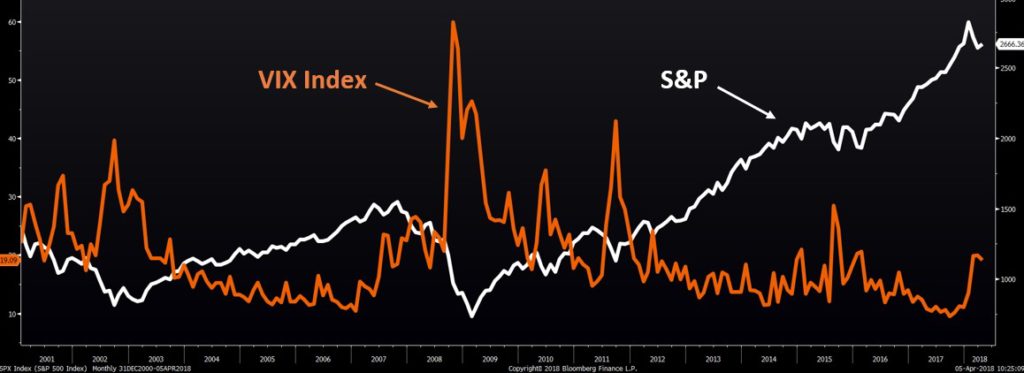
You can see in the chart below, when the market gets volatile (the VIX orange line),stocks tend to decline (the S&P 500 white line). If you have been following us every month, you know that we have stated repeatedly that the ultimate direction of volatile markets is DOWN . . . even though many of the volatile days are up.
Why is this happening? Maybe the correct question is “Why hasn’t it happened sooner?”
When markets are extremely cheap (you don’t get much cheaper than March 6, 2009, at the peak of economic panic and the nadir of the stock market), it’s difficult for stocks to decline much further. Why? This may sound simplistic, but the reason why stocks stop going down is because everyone who wanted out of the stock market is out of the stock market.
After a nine-year bull market, we believe we may have reached a point where pretty much everyone who wants to be in the stock market is in the stock market. What drives prices higher is demand, and when you run out of demand, it doesn’t take vast amounts of sellers to drive prices down.
One reason it may be difficult to rustle up new buyers is that, by most measures, stocks aren’t the bargain they used to be. And you could easily make a case that they are relatively expensive.
Below is a price chart of the S&P 500 going back to 1980, a nice visual that seems to say that even if stocks aren’t expensive, they definitely aren’t a bargain.
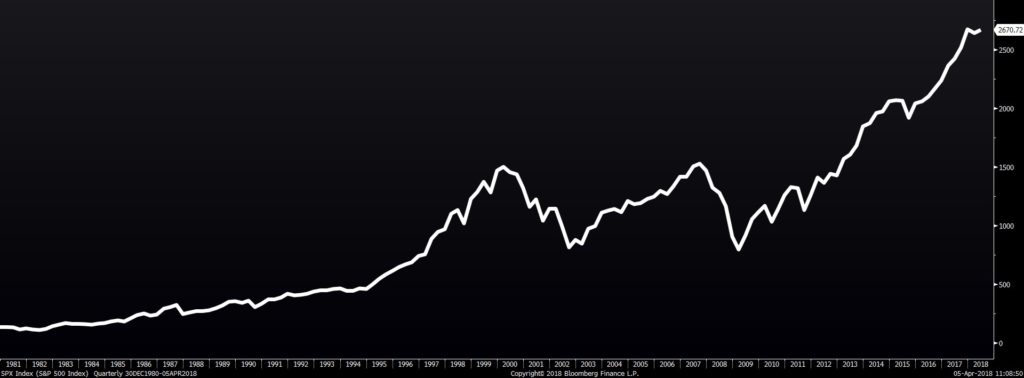
But looks can be deceiving. In a wonderful growth economy where earnings are increasing as fast or faster than stock prices, maybe stocks aren’t that pricey after all.
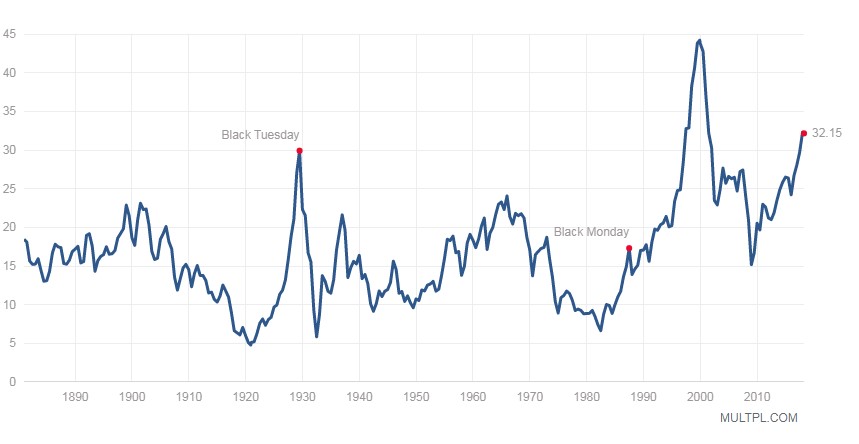
So we found a chart that takes stock prices and divides them by average ten-year earnings to get a better picture of how the stock market has been doing relative to companies’ earnings.
Today’s prices are surpassed ONLY by prices during the dot-com-mania days.
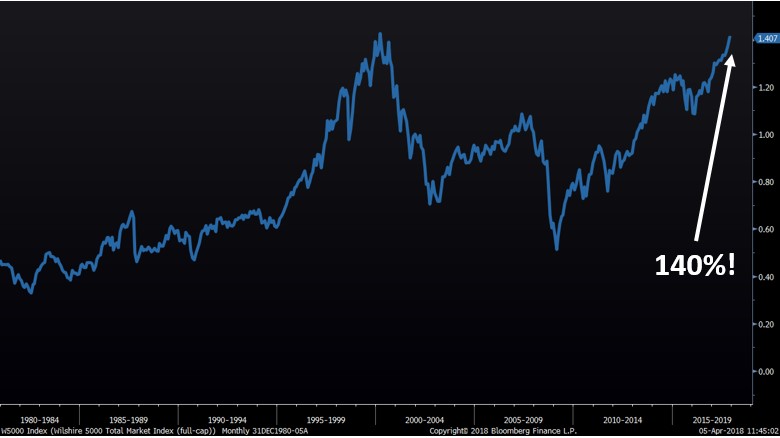
And just for fun, we created a chart using Warren Buffett’s favorite indicator. He likes to compare the total market capitalization of all U.S. stocks against the country’s gross domestic product (GDP). Today, the aggregate value of all U.S. stocks is 140% of our GDP, the highest measure since the peak of the dot-com bubble!
Stocks being expensive doesn’t mean they can’t get more so. The price of anything is simply what someone will pay for it. But at higher valuations, the probability for a selloff is greater.
Pundits have been falling over themselves to predict the next market downturn and have been proven wrong time and again. We haven’t disagreed that the market is overvalued, but absent other risk factors, we have been content to stay invested.
However, there are things that are starting to make us change our tune:
Volatility: For so long, bad news was simply shrugged off by the market. Today, specifically since the beginning of February, anything that comes along as a potential threat can easily spark a selloff. In February, it was the fear of accelerating inflation. Recently, it has been announcements of tariffs and worries about a trade war. Giant swings in the market are suddenly commonplace. And as we pointed out above, this is not healthy.
“Flattening” yield curve: Last month, in February Madness, we noted the dangers of a “flattening” yield curve (short-term interest rates rising above long-term interest rates). This is too complicated to explain in a bullet-point, so refer back to last month’s commentary for a refresher . . . or just trust us that it is not good.
Risk in the bond market: We keep our eye on how investors in the bond market are treating risk. If investors perceive more risk, they require more return (a higher interest rate on the bonds). This is evident when the yield on corporate bonds (vs. riskless treasury bonds) begins to rise, as it did in February this year. More risk in the bond market goes hand-in-hand with more risk in the stock market.
Flagging favorable winds: Tailwinds that have helped to propel the market to the valuations we are seeing today, such as monetary and fiscal stimulus (accommodative Fed policy, Trump’s tax plan, etc.), are less effective now, as many of the bullets in these guns have been spent.
At Boyer & Corporon Wealth Management, we are not in the business of timing markets, as Laura Carley mentioned in “The Hazards of Trying to Time the Market.” However, we actively monitor market signals and economic indicators and take measures to position our clients’ portfolios for protection against the downside, even if it means sacrificing some upside. As such, we recently began taking some gains in our equity positions in favor of maintaining a higher-than-normal cash level.
This information is provided for general information purposes only and should not be construed as investment, tax, or legal advice. Past performance of any market results is no assurance of future performance. The information contained herein has been obtained from sources deemed reliable but is not guaranteed.
This information is provided for general information purposes only and should not be construed as investment, tax, or legal advice. Past performance of any market results is no assurance of future performance. The information contained herein has been obtained from sources deemed reliable but is not guaranteed.